Vendor:
Founded:
Headquarters:
Pyramid Analytics
2008
Amsterdam, NL
Customers:
Deployment Model:
Free Trial:
500+
Cloud, On-Premise
Yes
Pyramid At A Glance
Product Overview
Pyramid Decision Intelligence Platform is an end-to-end platform that combines data prep, data science and business analytics features into one solution. Users can quickly prep data for analysis with a point-and-click interface, build machine learning models, easily connect with multiple data sources, and more. Pyramid can be deployed in the cloud, on premise or a hybrid of both.
This review will focus on the business analytics capabilities.
Pyramid’s business analytics suite is a self-service solution designed for any user, regardless of technical expertise. It includes a modern, no-code interface with AI-driven features, so any user can build their own analytical content.
Pyramid includes seven analytical modules: Model, Formulate, Discover, Illustrate, Present, Tabulate/Solve and Publish. We’ll describe each module in our Features section below.
Pyramid comes in three editions: Community, Standard and Enterprise. Here’s a snapshot of what each edition includes:
- Community – The Community edition is a free download. It’s limited to three Professional users (meaning those users have access to all six modules) and deployed on a single server. It includes light mapping feature and is accessible on a tablet. Support is limited to community forums.
- Standard – The Standard edition accommodates up to 100 Professional and Viewer users and is also deployed on a single server. Note that Viewer users refer to users that only interact with content shared by Professional users. This edition includes mobile phone access and standard mapping features.
- Enterprise – The Enterprise edition accommodates unlimited users and is deployed on multiple servers. It also includes publisher report bursting feature, in addition to the features in the Standard edition.
Features
Here are the key features of each module:
Model – In the Model module, users can prepare data and build data models. There is also the Business User ETL, a drag-and-drop interface for cleaning and preparing raw data for analysis. Some features include:
- Machine learning marketplace to find and use existing data science algorithms
- In-memory database engine
- Data modeling in native in-memory, Microsoft Tabular, SQL databases and big data engines
Discover – The Discover module allows users to run queries and perform visualizations on their analytical questions. Some of the features are:
- Ability to run fast queries on large datasets
- Drag-and-drop interface
- Over 200 visualization options
- Statistical analysis tools in push-button format
- Wizard-guided advanced analytics
- Smart Discover feature that uses AI/machine learning to auto analyze data
- “Explain” and “Explain the Difference” AI feature that lets users break down results with machine learning
- Chat Botf that answers users’ questions by providing applicable visualizations using the Smart Visualization engine
Formulate – The Formulate module includes a drag-and-drop interface for formulating custom expressions, lists and key performance indicators (KPIs). Some of the features in this module are:
- Ability to create sets, calculations, and advanced parameters
- Ability to share and reuse business logic
- Dynamic sets with branching logic
- Out-of-the-box aggregates, operators, and functions
Illustrate – The Illustrate module allows users to add text, infographics or illustrations of their data. Some of the features are:
- Dynamic infographics and data-driven dynamic text
- Reusable, sharable content across presentations and publications
- Composite visualizations (layered SVG and raster images)
- Custom visual workflows to illustrate processes
Present – In the Present module, users can create presentations from various data sources. The module includes features such as:
- Robust design control
- Master page support
- Fully interactive visuals
- Option to design mobile-specific layouts
- Interactions and shared slicing across multiple queries and data sources
- Integration with ChatGPT for faster content creation
Tabulate and Solve – The Tabulate module allows users to extend their data analysis within a browser-based spreadsheet interface. They can create business models with live data through query mashups and multi-query visualization, and they can also use spreadsheet formulas to create blended business models and data visualization from multiple data sources. There’s the Solve plug-in for users to build decision models within the spreadsheet to conduct what-if analysis and simulations.
Publish – In the Publish module, users can create narratives of their data. Features in this module are:
- Pixel-perfect report creation
- Industry-leading design control
- Master page support
- High-capacity report bursting with scheduling control
- Dynamic reporting with secure access
Target Market
Pyramid Analytics works with businesses from every industry, but has an especially strong presence in the higher education market. Below are listed several of their main clients:
- Siemens
- Blackboard
- Department of Veteran Affairs
- Voith
- Pilot Travel Centers
- Equifax
- Winthrop
- CDW
- Hallmark
- Drexel University
Free Report: Selecting The Right BI Vendor
 Choosing a BI vendor is all about finding the right fit. Our exclusive report will walk you through the process and help you select the perfect solution.Download Now
Implementation/Integration
Prospects can contact Pyramid Analytics’s sales team to set up a product demo. The implementation process can vary depending on the customer’s needs and requirements.
Customer Service & Support
Pyramid Analytics provides an online support center, where can uses can access a knowledge base, connect with other users in a community forum and submit ticket requests. They can also upgrade their skills with Pyramid’s Learning Hub of online courses with various topics that pertain to the software’s features.
Pricing
Pyramid Analytics doesn’t provide pricing details. Please contact the vendor directly for a quote.

How Much Does A BI Tool Cost?
Download our free report to compare pricing on 12 popular BI solutions including Microsoft Power BI, Tableau, Alteryx, Qlik and more.Download NowShortcomings
Because the software is robust, new users may find a steep learning curve, although Pyramid Analytics offers guides and courses via its Learning Hub.
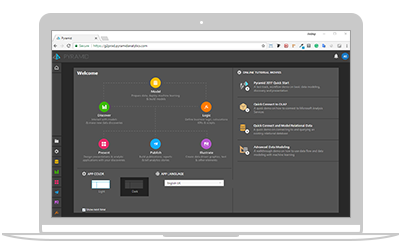
Screenshots


About
Pyramid Analytics is the next generation of business analytics. Its Pyramid Decision Intelligence Platform empowers people with augmented, automated, and collaborative insights that simplify and guide the use of data in decision-making. Pyramid Analytics is incorporated in Amsterdam and has regional headquarters in global innovation and business centers, including London, New York City, and Tel Aviv.
Download Comparison Guide